Marketing Channel ROI: How to Calculate Effectiveness with Lifecycle and Decay Models
"Our average marketing ROI is 320%." I hear this at every other pitch. And every time I ask the same question: "By which channels?" The answer is silence or vague numbers blended into mush.
Average ROI across all channels is a useless metric. It hides that one channel returns 800% while another loses money. It doesn't account for the fact that channel effectiveness changes over time. And it certainly doesn't help you decide where to put the next dollar of your marketing budget.
In this article, we'll break down the lifecycle of marketing channels, the right ROI and ROAS formulas, the funnel from reach to sale, and the portfolio approach to budget allocation.
Why "Average ROI Across All Channels" Is Useless
Imagine: you spend 5,000 on TikTok. Google generates 3,000. Average ROI:
Looks decent. But by channel:
| Channel | Spend | Revenue | ROI |
|---|---|---|---|
| Google Ads | $10,000 | $25,000 | 150% |
| TikTok Ads | $5,000 | $3,000 | -40% |
| Average | $15,000 | $28,000 | 86.7% |
TikTok is losing money. The average ROI hides it. If you decide "ROI looks good, let's increase budget proportionally," you'll scale the TikTok losses.
The problem runs deeper. Organic channels (SEO, content, WOM) and paid channels are apples and oranges. Organic has low direct costs but a long ramp-up. Paid channels deliver instant results but at high cost and with eventual decay. Blending them into a single metric means you understand neither.
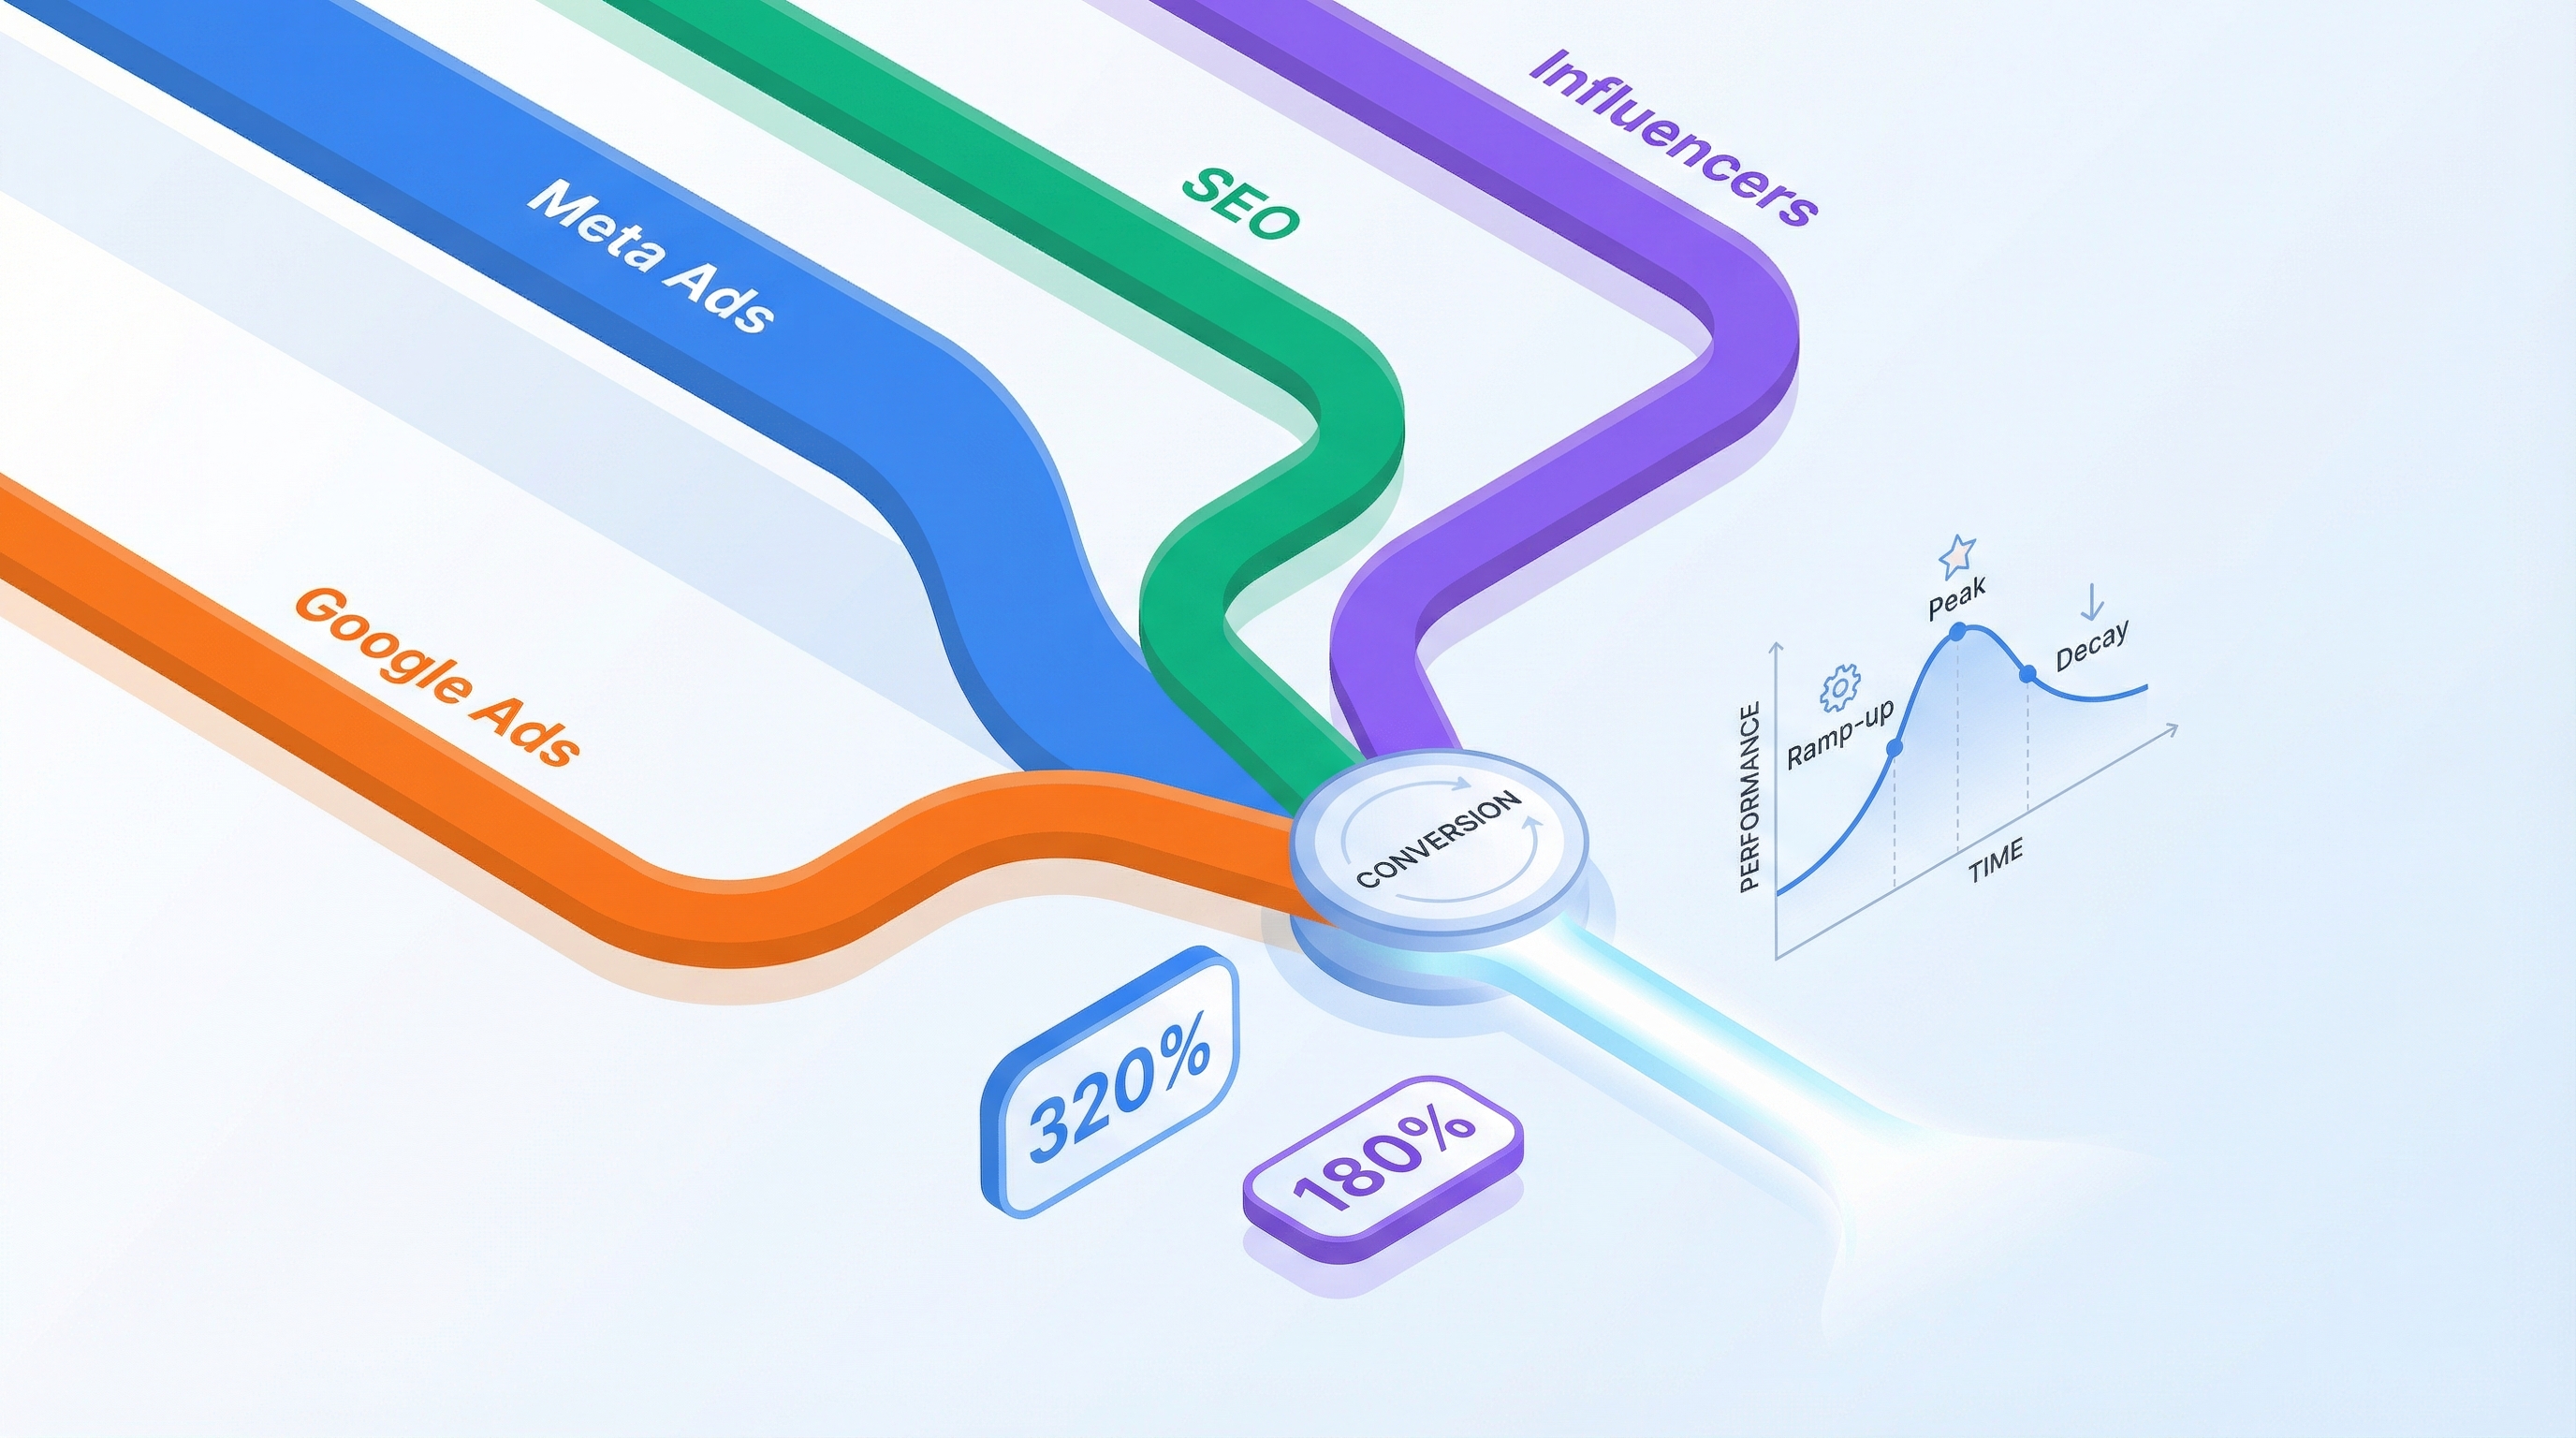
Marketing Channel Lifecycle
Every marketing channel follows a predictable lifecycle. In my experience, I've seen this pattern again and again -- from Meta Ads to referral programs. Understanding the lifecycle lets you forecast channel performance months ahead and make decisions based on the model, not just current data.
Phase 1 -- Delay: Time Before First Effect
Not all channels start delivering immediately. Paid advertising (Meta, Google) produces first results the same day. But SEO might not generate meaningful traffic for 1-3 months. A referral program needs time to build critical mass.
Delay is the "dead zone": you're spending money but seeing no results yet. This is normal, but it must be factored into your financial model. Otherwise you'll overestimate effectiveness in early months (if delay = 0) or panic that a channel isn't working (if delay > 0).
Phase 2 -- Ramp-up: Reaching Full Capacity
After the delay, the channel starts producing results -- but not at maximum right away. Ramp-up is the period of scaling from 0% to 100% capacity.
Ramp-up speed depends on the channel type:
- Paid advertising: 1-2 months (algorithm learning, creative optimization, audience testing)
- SEO: 3-6 months (indexing, building backlinks, ranking improvements)
- WOM/referral: 6-12 months (needs a base of loyal users)
The ramp-up profile can be linear (steady growth) or exponential (slow start, then sharp acceleration). Exponential is typical for channels with network effects.
Phase 3 -- Peak: Maximum Effectiveness
The channel has reached its potential and operates at 100% capacity. This is the "golden period," but it doesn't last forever. For paid channels, peak might last 2-8 months; for organic channels, significantly longer.
Phase 4 -- Decay: Declining Effectiveness and Floor
Most channels lose effectiveness over time:
- Meta Ads: audience fatigue (ad fatigue), rising CPM, competition for audience
- Influencer marketing: audience already saw the recommendation, repeat effect weakens
- Google UAC: target audience saturation, rising CPI
- TikTok: rapid creative burnout
Decay isn't a drop to zero. The channel stabilizes at a certain level -- the floor. Meta Ads might drop to 50% of peak effectiveness and hold. This means the channel continues working, just less effectively.
Channels without decay: SEO and WOM/referral. They build a foundation that continues working (and even strengthens) over time.
Lifecycle Parameters for 8 Typical Channels
| Channel | Delay (mo) | Ramp-up (mo) | Ramp-up Profile | Decay (mo) | Floor (%) | Decay Profile |
|---|---|---|---|---|---|---|
| Meta Ads | 0 | 2 | Exponential | 8 | 50% | Linear |
| TikTok Ads | 0 | 1 | Exponential | 5 | 40% | Exponential |
| Apple Search Ads | 0 | 1 | Linear | 12 | 75% | Linear |
| Google UAC | 0 | 2 | Exponential | 10 | 55% | Linear |
| Micro-Influencers | 1 | 2 | Linear | 3 | 20% | Exponential |
| ASO / SEO | 1 | 5 | Exponential | -- | -- | -- |
| Social Organic | 1 | 6 | Exponential | 18 | 65% | Linear |
| WOM / Referral | 2 | 8 | Exponential | -- | -- | -- |
How to read the table: Meta Ads starts with no delay, ramps up over 2 months (exponentially), then after 8 months begins decaying linearly to 50% of peak. ASO/SEO starts with a 1-month delay, takes 5 months to ramp up, but never decays -- the investment in organic works indefinitely.
These numbers are benchmarks from dozens of projects I've analyzed. Your actual values will vary depending on niche, geography, and product. But the pattern is universal: delay, ramp-up, peak, decay.
Formulas: ROI, ROAS, Channel CAC
ROI (Return on Investment)
Total Cost includes everything: ad budget, salaries, tools, content. ROI of 100% means you earned twice what you spent.
ROAS (Return on Ad Spend)
ROAS is calculated only from the advertising budget, without salaries and tools. ROAS = 3x means "every dollar spent on ads generated $3 in revenue."
ROI vs ROAS: for operational decisions (campaign optimization) use ROAS. For strategic decisions (hire a marketer? open a new channel?) use full ROI.
Channel CAC
Blended CAC vs Channel CAC
Blended CAC is useful for the big picture. Channel CAC is for making decisions about specific channels. In my experience, the difference between the best and worst channel by CAC can be 5-10x.
Example:
| Channel | Budget/mo | New Customers | Channel CAC | ROAS |
|---|---|---|---|---|
| Google Ads | $8,000 | 120 | $66.67 | 4.8x |
| Meta Ads | $6,000 | 85 | $70.59 | 3.6x |
| TikTok Ads | $4,000 | 35 | $114.29 | 1.8x |
| Apple Search | $3,000 | 60 | $50.00 | 6.2x |
| Micro-Influencers | $2,500 | 20 | $125.00 | 2.1x |
| SEO / Content | $2,000 | 45 | $44.44 | 8.5x |
| Referral | $1,500 | 50 | $30.00 | 12.3x |
| Blended | $27,000 | 415 | $65.06 | 4.7x |
Referral is the best channel by CAC (114 and 1.8x). Blended CAC of $65 hides this gap. More on full CAC calculation and its connection to LTV in the article about unit economics.
Channel Funnel: From Reach to Sale
Every channel operates through a funnel. Understanding conversion at each stage is key to forecasting and optimization.
Example for a mobile app via Meta Ads:
| Stage | Metric | Value | Absolute Number |
|---|---|---|---|
| Reach | Audience reached | 200,000 | 200,000 |
| Clicks | CTR | 2.0% | 4,000 |
| Installs | Conv. to Install | 10% | 400 |
| Sales (registrations) | Conv. to Sale | 20% | 80 |
80 new customers per month. At a 75.
The same calculation for Google UAC:
| Stage | Metric | Value | Absolute Number |
|---|---|---|---|
| Reach | Audience reached | 150,000 | 150,000 |
| Clicks | CTR | 3.5% | 5,250 |
| Installs | Conv. to Install | 8% | 420 |
| Sales | Conv. to Sale | 25% | 105 |
105 customers. At an 76.19.
Conversion at each stage depends on dozens of factors: creative, offer, landing page, product UX, pricing. Funnel optimization isn't "increase the budget" -- it's "find the weak link and strengthen it."
Important nuance: conversion at each stage isn't constant. It depends on the channel's lifecycle phase. During ramp-up, conversion improves (algorithms learn). During decay, it drops (audience burns out). Planning budget based on peak conversion is a mistake.
Modeling Channels in a Financial Model
Why Lifecycle Must Be in Your Forecast
The typical mistake: projecting constant channel performance across all 36 months. "Meta Ads generates 100 customers per month at $60" -- and this number stays flat from month 1 to month 36.
Reality: by month 12, Meta Ads delivers not 100 but 50-60 customers at the same budget (decay). Or CAC has risen from 90. If your model doesn't reflect this, your revenue forecast is overstated by 30-40%.
Channel Effectiveness Formula with Lifecycle
where is the time since the decay phase started.
Linear ramp-up function:
Exponential ramp-up function:
activeMonths: When the Channel Is Active
Not all channels are active for all 36 months of the forecast. Seasonal campaigns, limited budgets, test launches -- all determine which months a channel is on.
In a financial model, activeMonths is an array of month indices when the channel operates. A channel launched in month 3 and turned off at month 18 has activeMonths = [3, 4, 5, ..., 17].
Seasonality
Some channels have seasonal fluctuations: e-commerce peaks in November-December, B2B SaaS slows in August and December. Seasonal multipliers overlay on the lifecycle:
Budget Allocation: The Portfolio Approach
The Concentration Problem
Putting your entire budget into one channel is risky. Algorithms change (remember iOS 14.5 and the Meta Ads crash?), channels burn out, competition intensifies. A portfolio approach reduces dependence on any single source.
The 70/20/10 Rule
In my experience, this allocation works well:
| Share | Channel Type | Goal | Examples |
|---|---|---|---|
| 70% | Proven channels | Stable flow | Google Ads, Meta Ads, SEO |
| 20% | Growing channels | Scaling | TikTok, Influencers, Partnerships |
| 10% | Experiments | Discovery | Reddit Ads, Podcast sponsoring, Offline |
70% of the budget goes to channels with proven ROI. 20% to channels with potential that are in ramp-up. 10% to experiments that might become tomorrow's channels (or might not -- and that's fine).
Balancing Fast and Long-Term Channels
| Fast (Paid) | Long-term (Organic) | |
|---|---|---|
| First results | Days | Months |
| Scalability | Limited (decay) | High (no decay) |
| CAC | High | Low |
| Dependency | On platform | On content |
| If turned off | Instant stop | Inertia for months |
| ROI | Fast but declining | Slow but growing |
Early-stage startups need fast channels: validate hypotheses, acquire first customers, confirm unit economics. But in parallel, invest in long-term channels: SEO, content, WOM. In 12-18 months, they'll become the growth foundation with low CAC.
When to Kill a Channel
A channel should be paused or reconsidered if:
- Channel CAC > LTV -- the channel is unprofitable. If this isn't a ramp-up phase, cut it immediately
- ROAS < 1.5x at stable lifecycle -- the margin is too thin to cover overhead
- Decay has reached floor, and floor < 30% -- the channel is burned out, ROI will only decline further
- Channel's share > 40% of budget -- dangerous concentration, find alternatives
Practical Example: Channel Mix Evolution Over 18 Months
Let's walk through a realistic scenario. A startup launches a B2B SaaS product. Marketing budget: $25,000/mo. Target: 300 new customers per month.
Months 1-3 (launch): 90% of budget on paid channels. Need customers fast for validation.
| Channel | Budget | Customers | CAC | Lifecycle Phase |
|---|---|---|---|---|
| Google Ads | $12,000 | 140 | $85.71 | Ramp-up |
| Meta Ads | $8,000 | 95 | $84.21 | Ramp-up |
| SEO / Content | $3,000 | 5 | $600.00 | Delay |
| Referral | $2,000 | 3 | $666.67 | Delay |
| Total | $25,000 | 243 | $102.88 |
SEO and referral are still in the delay phase -- high CAC is expected. Overall result: 243 customers, target not met, but that's normal during ramp-up.
Months 6-9 (growth): paid channels at peak, organic gaining momentum.
| Channel | Budget | Customers | CAC | Lifecycle Phase |
|---|---|---|---|---|
| Google Ads | $10,000 | 155 | $64.52 | Peak |
| Meta Ads | $6,000 | 90 | $66.67 | Peak |
| SEO / Content | $4,000 | 35 | $114.29 | Ramp-up |
| Referral | $3,000 | 28 | $107.14 | Ramp-up |
| TikTok (test) | $2,000 | 18 | $111.11 | Ramp-up |
| Total | $25,000 | 326 | $76.69 |
Target achieved. Google Ads and Meta hit peak. SEO starts delivering results. Blended CAC dropped 25%.
Months 15-18 (maturity): paid channels in decay, organic became the foundation.
| Channel | Budget | Customers | CAC | Lifecycle Phase |
|---|---|---|---|---|
| Google Ads | $7,000 | 95 | $73.68 | Decay (65%) |
| Meta Ads | $4,000 | 48 | $83.33 | Decay (55%) |
| SEO / Content | $5,000 | 85 | $58.82 | Peak |
| Referral | $4,000 | 72 | $55.56 | Peak |
| TikTok | $3,000 | 15 | $200.00 | Decay (40%) |
| Partnerships | $2,000 | 22 | $90.91 | Ramp-up |
| Total | $25,000 | 337 | $74.18 |
Same budget -- more customers and lower blended CAC. The reason: organic channels (SEO + referral) now deliver 157 out of 337 customers (47%) with CAC below $60. TikTok should be killed -- decay has hit the floor, CAC has doubled.
This example clearly shows why you can't use a flat line in your financial model. Over 18 months, the channel mix structure completely transformed.
How to Track ROI in Real Time
Tracking channel ROI isn't a one-time exercise. It's a regular process with a specific cadence:
Weekly: monitor ROAS and CTR for active paid channels. A sharp ROAS drop signals it's time to refresh creatives or audiences.
Monthly: calculate Channel CAC with all costs included (including salaries). Compare with LTV of cohorts from each channel. Update lifecycle parameters if real data diverges from the model.
Quarterly: review the channel portfolio. Reallocate budget from decaying channels to growing ones. Launch new experiments (the 10%).
When building a P&L model, acquisition channels aren't just an expense line. They're the source of your sales forecast, linked to unit economics. In ProductWave, each channel is configured with lifecycle parameters (delay, ramp-up, peak, decay), funnel conversion rates, and activeMonths -- and the model automatically calculates a sales forecast that accounts for decay, not a flat line.
Checklist: How Not to Waste Money on Channels
Before approving next month's marketing budget, run through this list:
- Are you calculating ROI and CAC for each channel separately? Average ROI across all channels hides money-losers behind winners. Blended CAC masks a channel that costs 5x more than average.
- Are you accounting for each channel's lifecycle? Delay, ramp-up, peak, decay -- if your model shows a flat line of "100 customers per month for 36 months," the forecast is unrealistic.
- Is the channel showing signs of decay? CAC rising for two months straight, ROAS dropping below 1.5x, floor < 30% -- time to reallocate budget.
- Is your budget diversified? 70/20/10: proven channels, growing channels, experiments. No single channel should exceed 40% of spend.
- Are you investing in long-term channels alongside paid? SEO, content, referral programs -- in 12-18 months they'll become your low-CAC growth foundation.
- Do you review the channel portfolio quarterly? Shift budget from decaying channels to growing ones, launch new experiments.
- Are lifecycle parameters built into your financial model? A forecast without ramp-up and decay overstates revenue by 30-40% by month 12.
With ProductWave, every acquisition channel is modeled with full lifecycle: you set delay, ramp-up, decay, and floor -- and see a realistic 36-month sales forecast. Not a flat line, but a curve that reflects how marketing channels actually behave.
February 5, 2026
AnalyticsStartupsGuideProduct Management