Unit Economics: Complete Guide with Formulas, Examples, and Real Project Calculations
I've seen dozens of startups shut down not because of a bad product, but because they never calculated their unit economics. The founder was convinced that "customers are coming," marketing "works," and MRR is growing. Then it turns out every acquired user generates a loss. Growth just scales the bleeding.
Unit economics is the only way to know the truth about your business at the individual customer level. This article is a complete guide: every formula, three ways to calculate LTV, industry benchmarks, and a step-by-step example for a real SaaS product.
What Unit Economics Is and Why It Matters
Unit economics is the analysis of revenue and costs per single unit. The "unit" depends on your business model: for SaaS it's a subscriber, for a marketplace it's a transaction, for e-commerce it's an order.
The fundamental question: do you earn more from each customer than you spend to acquire and serve them?
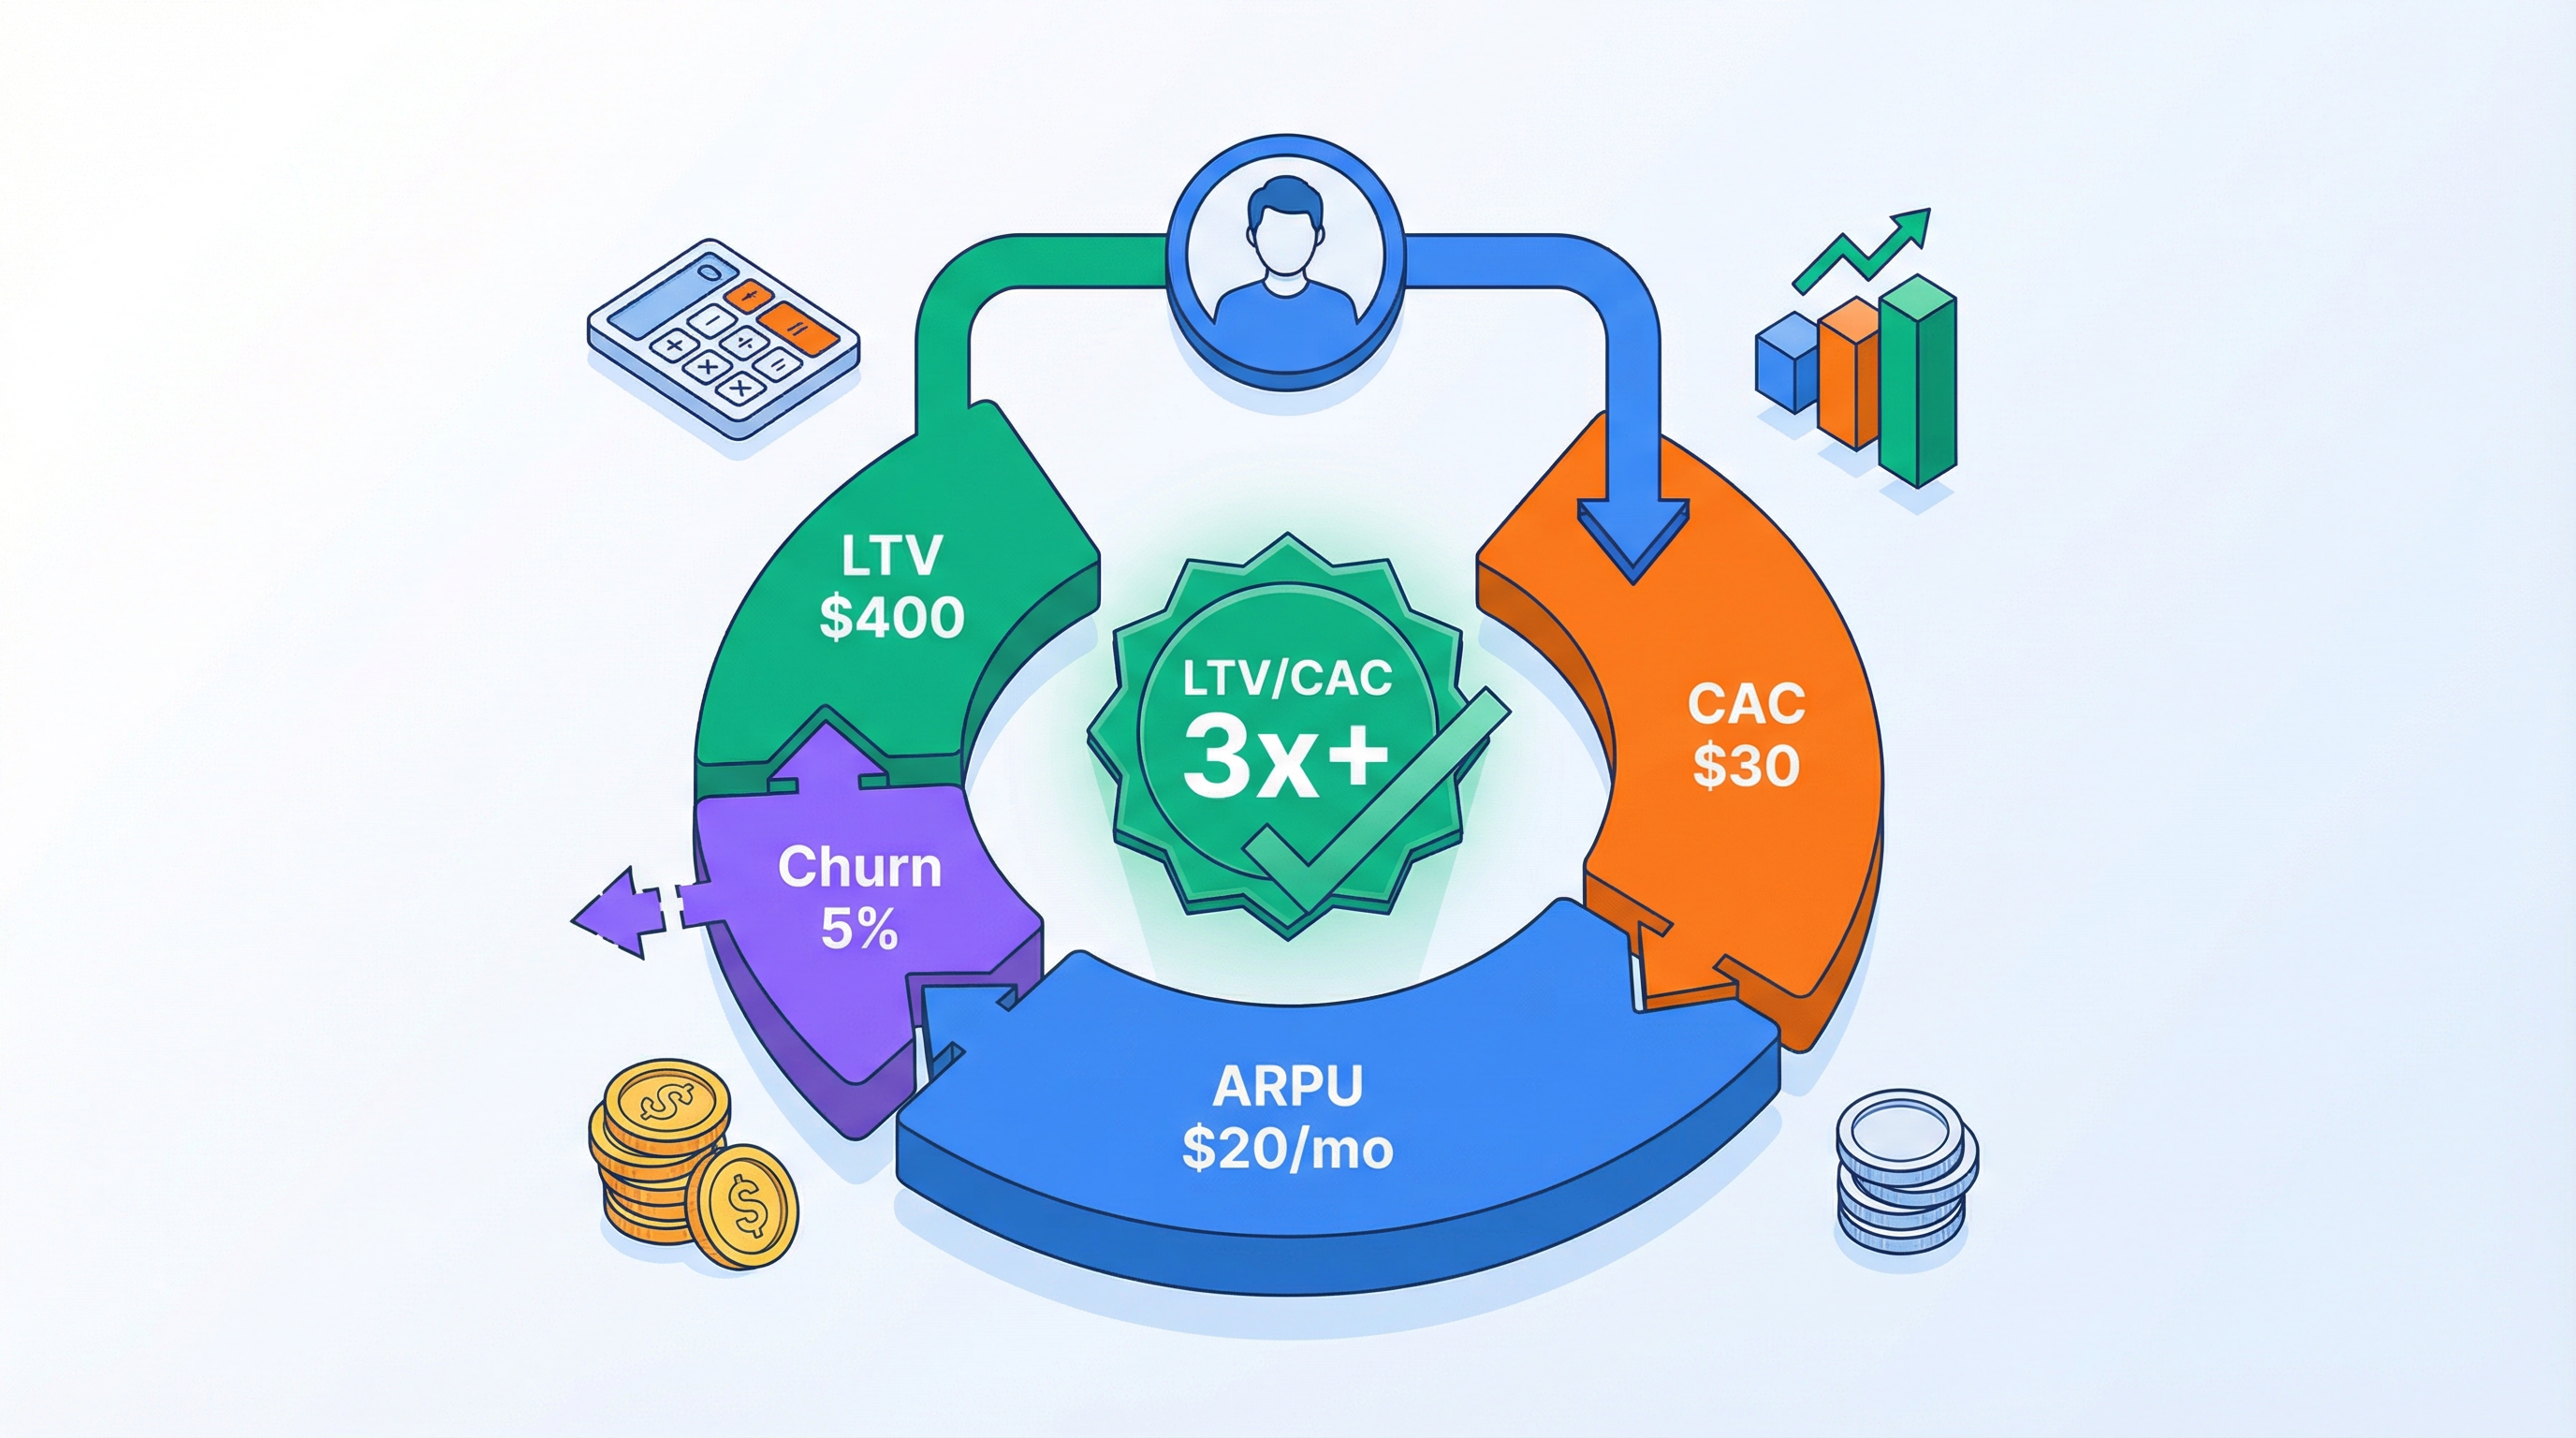
If LTV > CAC, the business model works. If LTV < CAC, every new customer deepens the losses. Scaling in that scenario is a path to bankruptcy.
When to Start Calculating
In my experience, the ideal moment is when you get your first paying customers. Not earlier (no data) and not later (money already wasted).
MVP stage: a rough calculation is enough — average ticket, approximate churn, ad budget. This gives you an order-of-magnitude understanding.
Product-Market Fit: time to calculate by cohort and channel. You have enough data for statistically meaningful conclusions.
Before a funding round: unit economics is the first thing an investor will ask about. Without it, the dialogue is impossible. And they'll want to see not just current numbers but the trend: how metrics changed over the past 6-12 months.
When scaling: increasing your marketing budget without monitoring unit economics is like flooring the gas pedal with your eyes closed.
Key Unit Economics Metrics
ARPU and ARPPU: Average Revenue Per User
ARPU (Average Revenue Per User) — average revenue per active user for a given period:
ARPPU (Average Revenue Per Paying User) — average revenue per paying user:
The difference is critical for freemium models. If you have 10,000 active users but only 500 pay, ARPU and ARPPU differ by a factor of 20:
| Metric | Formula | Example |
|---|---|---|
| Revenue | — | $15,000/mo |
| Active users | — | 10,000 |
| Paying users | — | 500 |
| ARPU | $15,000 / 10,000 | $1.50 |
| ARPPU | $15,000 / 500 | $30.00 |
In my experience, the number one mistake is calculating LTV from ARPPU but CAC across all users (including free). This inflates LTV/CAC and creates an illusion of profitability. Use the same base: either all users or only paying ones.
CAC: Customer Acquisition Cost (Full Formula)
CAC (Customer Acquisition Cost) — the total cost of acquiring one customer. A typical mistake I see in 80% of models: CAC only includes ad spend. That's wrong.
The full formula:
Example of full CAC calculation:
| Cost Item | Monthly Amount |
|---|---|
| Ad budget (Meta + Google) | $12,000 |
| Marketer salary | $4,000 |
| Designer salary (50% on creatives) | $1,500 |
| Tools (analytics, CRM, email) | $800 |
| Content (copywriting, video) | $1,200 |
| Total acquisition costs | $19,500 |
| New customers | 350 |
| CAC | $55.71 |
If we only counted ad budget, CAC would be $34.29 — 38% lower than reality. This distortion makes the model useless for decision-making.
For multi-channel attribution, you need Channel CAC — the acquisition cost through a specific channel. More on this in the article about marketing channel ROI.
LTV: Lifetime Value (3 Calculation Methods)
LTV (Lifetime Value) — the total revenue a single customer generates over their entire relationship with your product. There are three main calculation methods, each with its own strengths.
Method 1: Through Average Churn (Simple)
Example: ARPU = $29/mo, churn = 5%/mo.
Pro: simplicity. Con: assumes constant churn, which rarely holds in practice. Churn is typically higher in early months and drops for loyal customers.
Method 2: Through Average Customer Lifetime
Example: ARPU = $29, churn = 5%.
Same result, but more intuitive — you can see how long an average customer stays.
Method 3: Through Retention Curve (Most Accurate)
where is the retention rate at month .
Example with a real retention curve:
| Month | Retention | Revenue per Cohort (100 customers) |
|---|---|---|
| 1 | 100% | $2,900 |
| 2 | 72% | $2,088 |
| 3 | 58% | $1,682 |
| 4 | 48% | $1,392 |
| 5 | 42% | $1,218 |
| 6 | 38% | $1,102 |
| 7 | 35% | $1,015 |
| 8 | 33% | $957 |
| 9 | 31% | $899 |
| 10 | 30% | $870 |
| 11 | 29% | $841 |
| 12 | 28% | $812 |
To get the full LTV, extend the curve to stabilization. If retention stabilizes at 28%, the residual LTV:
Notice: this is lower than the $580 from the simple formula. The simple method overestimates LTV because it doesn't account for high early churn. More on working with retention curves in the article on cohort analysis.
LTV/CAC: The Golden Ratio
This is the primary indicator of business model health:
| LTV/CAC | Interpretation |
|---|---|
| < 1.0 | Business loses money on every customer. Stop |
| 1.0 — 2.0 | Minimal payback. Needs optimization |
| 2.0 — 3.0 | Survival zone. Works, but no margin of safety |
| 3.0 — 5.0 | Healthy economics. Gold standard |
| > 5.0 | Excellent, but verify: you may be underinvesting in growth |
The paradox: LTV/CAC > 5 isn't always good. Often it means you're spending too little on marketing and leaving the market to competitors. A competitor with LTV/CAC = 3.5 and aggressive growth may take your niche.
Payback Period: When a Customer Pays for Itself
If ARPU = 4, CAC = $56:
Benchmarks:
| Business Type | Target Payback |
|---|---|
| SaaS (SMB) | < 12 months |
| SaaS (Enterprise) | < 18 months |
| E-commerce | < 3 months |
| Mobile app | < 6 months |
| Marketplace | < 12 months |
Payback matters more than LTV/CAC for cash-constrained startups. LTV/CAC could be 5x, but if payback is 24 months, you might run out of cash before customers pay for themselves.
Contribution Margin: Per-Unit Margin
Contribution Margin shows how much money from each customer actually remains after deducting all variable costs:
Example for SaaS:
| Component | Amount |
|---|---|
| ARPU | $29.00 |
| Hosting / infrastructure | -$2.10 |
| Payment processor (3.5%) | -$1.02 |
| Support (proportional) | -$0.90 |
| Contribution Margin | $24.98 |
| CM% | 86.1% |
For SaaS, a normal CM% is 75-90%. For e-commerce, 20-45%. For marketplaces, 60-80%.
Contribution Margin is what actually goes toward covering fixed costs and generating profit. This is what you should use in Payback Period calculations instead of raw ARPU.
Formula Cheat Sheet
| Metric | SaaS (Subscription) | Marketplace (Transactions) | E-commerce (Purchases) |
|---|---|---|---|
| Unit | Subscriber | Transaction | Order |
| ARPU | Subscription revenue / All users | Take rate * GMV / Sellers | Avg. ticket * Frequency / Buyers |
| CAC | (Marketing + Salaries + Tools) / New paying users | (Marketing + Salaries) / New sellers OR buyers | (Marketing + Salaries) / New buyers |
| LTV (simple) | ARPU / Churn | ARPU * Avg. transactions | Avg. ticket * Lifetime purchases |
| LTV (accurate) | ARPU * SUM(Retention) | Avg. commission * SUM(cohort transactions) | Avg. ticket * SUM(cohort purchases) |
| CM | ARPU - Hosting - PSP - Support | Commission - Fraud - PSP - Support | Product margin - Shipping - Returns |
| Payback | CAC / CM | CAC / CM per transaction | CAC / (Avg. margin * Frequency) |
| LTV/CAC | LTV / CAC, target > 3x | LTV / CAC, target > 3x | LTV / CAC, target > 3x |
Step-by-Step Calculation: SaaS Product at $29/mo
Let's walk through a realistic example. You're launching a B2B SaaS project management tool. Plans: 59/mo (pro), $149/mo (team). Weighted average ARPU based on plan distribution:
| Plan | Price | Customer Share | ARPU Contribution |
|---|---|---|---|
| Basic | $29 | 55% | $15.95 |
| Pro | $59 | 35% | $20.65 |
| Team | $149 | 10% | $14.90 |
| ARPU | 100% | $51.50 |
Step 1: CAC by Channel
| Channel | Budget/mo | New Customers | Channel CAC |
|---|---|---|---|
| Google Ads | $8,000 | 95 | $84.21 |
| Meta Ads | $5,500 | 78 | $70.51 |
| Content marketing | $3,200 | 42 | $76.19 |
| Referral program | $1,800 | 55 | $32.73 |
| Organic (SEO) | $1,500 | 38 | $39.47 |
| Total | $20,000 | 308 | Blended: $64.94 |
Plus marketing overhead:
| Item | Monthly Amount |
|---|---|
| Head of Marketing salary | $5,500 |
| Content manager salary | $2,800 |
| Tools (HubSpot, Amplitude, Figma) | $1,200 |
| Total overhead | $9,500 |
Note the gap: Blended CAC from pure ad spend is 95.78. That's a 47% difference. This gap is exactly what most commonly masks unprofitable unit economics.
Step 2: LTV Through Retention Curve
Using cohort analysis data over 12 months:
| Month | Retention | Month | Retention |
|---|---|---|---|
| 0 | 100% | 6 | 52% |
| 1 | 82% | 7 | 49% |
| 2 | 71% | 8 | 47% |
| 3 | 64% | 9 | 45% |
| 4 | 59% | 10 | 44% |
| 5 | 55% | 11 | 43% |
After month 11, retention stabilizes. Monthly churn at plateau: ~2.3%.
Cumulative retention over 12 months:
LTV for the first 12 months:
Residual LTV (from month 13 onward, retention at 43% plateau, churn 2.3%):
For comparison, LTV through the simple formula (average churn across all periods ~6.8%):
The simple formula underestimates LTV by 43% because it doesn't account for churn stabilizing at the plateau.
Step 3: Payback Period and Contribution Margin
Variable costs per customer:
| Item | Monthly Amount |
|---|---|
| AWS (proportional) | $3.20 |
| Stripe (2.9% + $0.30) | $1.79 |
| Support (Intercom, proportional) | $1.40 |
| Total variable | $6.39 |
Step 4: Final Assessment — Is the Model Viable?
| Metric | Value | Benchmark | Assessment |
|---|---|---|---|
| ARPU | $51.50 | $30-80 for SMB SaaS | Normal |
| CAC (full) | $95.78 | $50-200 for B2B SaaS | Normal |
| LTV (retention curve) | $1,329 | $500-2,000 for SMB SaaS | Good |
| LTV/CAC | 13.9x | > 3x | Excellent |
| Payback | 2.1 months | < 12 months | Excellent |
| CM% | 87.6% | 75-90% | Good |
The model is viable. LTV/CAC = 13.9x, which is actually too high — it's a signal that you could increase marketing spend and grow faster. Doubling the marketing budget would raise CAC (say, to $140), but LTV/CAC would still be 9.5x, which is excellent.
Industry Benchmarks
| Industry | LTV/CAC | Payback Period | Monthly Churn | CM% |
|---|---|---|---|---|
| SaaS (SMB) | 3x — 8x | 6 — 14 mo | 3% — 7% | 75% — 90% |
| SaaS (Enterprise) | 5x — 15x | 12 — 24 mo | 0.5% — 2% | 80% — 92% |
| E-commerce (D2C) | 1.5x — 4x | 1 — 4 mo | N/A (purchase frequency) | 20% — 45% |
| Marketplace | 3x — 10x | 6 — 18 mo | 2% — 5% (sellers) | 60% — 80% |
| Fintech (B2C) | 3x — 7x | 8 — 18 mo | 3% — 8% | 55% — 75% |
| Mobile Gaming | 1.5x — 3x | 1 — 3 mo | 15% — 30% (D30) | 70% — 85% |
| EdTech | 2x — 6x | 4 — 12 mo | 5% — 10% | 65% — 85% |
| HealthTech | 4x — 12x | 8 — 18 mo | 2% — 5% | 70% — 88% |
Important caveat: benchmarks are useful for orientation, but every product is unique. You're not competing with "average SaaS" — you're competing with specific products in your market. Use benchmarks as a sanity check, not as targets.
Also keep in mind that benchmarks reflect mature companies. For an early-stage startup, LTV/CAC = 2x may be perfectly fine if the metric is improving month over month.
How Unit Economics Fits Into a P&L Model
Unit economics is the micro level. A P&L model is the macro level. The connection between them is direct.
From Unit Metrics to Revenue Forecast
Here is the channel effectiveness function at month , accounting for ramp-up and decay. More on this in the article about marketing channel ROI.
From Unit Economics to Break-Even
Example: fixed costs 45.11/customer.
In ProductWave, these calculations are linked automatically: unit economics from revenue streams and acquisition channels projects onto a full P&L model with cohort retention, channel lifecycle, and fixed costs factored in.
Common Mistakes in Unit Economics Calculations
1. CAC Without Marketing Salaries
The most frequent mistake. Ad budget is only 50-70% of real acquisition costs. The rest: salaries, tools, agencies, content. Ignoring these understates CAC by 30-50%.
Check yourself: if your marketer runs A/B tests, builds landing pages, configures campaigns — their salary belongs in CAC. If a designer spends even 30% of their time on ad creatives — 30% of their salary goes into CAC.
2. LTV from Averages Without Cohorts
Average churn across your entire user base is like the average temperature in a hospital. Customers from different channels, different time periods, on different plans behave differently.
In my experience, LTV from Google Ads can be 2-3x lower than LTV from referral programs. If you calculate from averages, you can't see that one channel generates unprofitable customers while another produces highly profitable ones.
3. Ignoring Cohort Differences
The January cohort and the July cohort may have completely different retention patterns. Seasonality, product changes, channel shifts — everything matters. Mixing cohorts into a single average is a path to bad decisions.
4. Contribution Margin = ARPU
No. ARPU is gross revenue. You need to subtract variable costs: infrastructure, payment processing, support. For SaaS the difference is typically 10-15%, but for marketplaces or e-commerce, variable costs can be 50-70% of revenue.
5. LTV Without Discounting
100 today. For long-horizon calculations (LTV > 24 months), use discounted LTV:
where is the monthly discount rate. At a 15% annual rate: .
6. Not Recalculating Unit Economics Regularly
Unit economics isn't a photograph, it's a movie. Metrics change every month. Churn can spike after a product update, CAC can shift after advertising platform algorithm changes, ARPU can change after introducing a new plan.
Minimum: recalculate monthly, broken down by cohort and channel.
Wrapping Up
Five takeaways worth remembering:
-
Unit economics is the language investors speak. Without CAC, LTV, and Payback Period, fundraising conversations are impossible.
-
CAC is more than ad spend. Salaries, tools, content — everything related to acquisition counts. Underestimating CAC is the most common path to false conclusions.
-
LTV through a retention curve is more accurate than the simple formula. The simple method (ARPU / Churn) works for ballpark estimates, but decisions require cohort-level calculations.
-
LTV/CAC > 3 is the gold standard, not a dogma. At an early stage, 2x can be fine. And > 5x may signal you're underinvesting in growth.
-
Unit economics lives inside a P&L model. Isolated metrics give an incomplete picture. Real power comes from linking unit economics to revenue forecasts, costs, and break-even.
With ProductWave, unit economics is calculated automatically based on your channels, revenue streams, and retention curve — and instantly projected onto a full P&L model with a 36-month forecast. No spreadsheets, no manual formulas, with dashboard visualization built in.
January 20, 2026
Unit EconomicsStartupsGuideSaaS